When is Earned Value Management (EVM) applicable?
We say: in every single construction project.
We are not the only ones who think so.
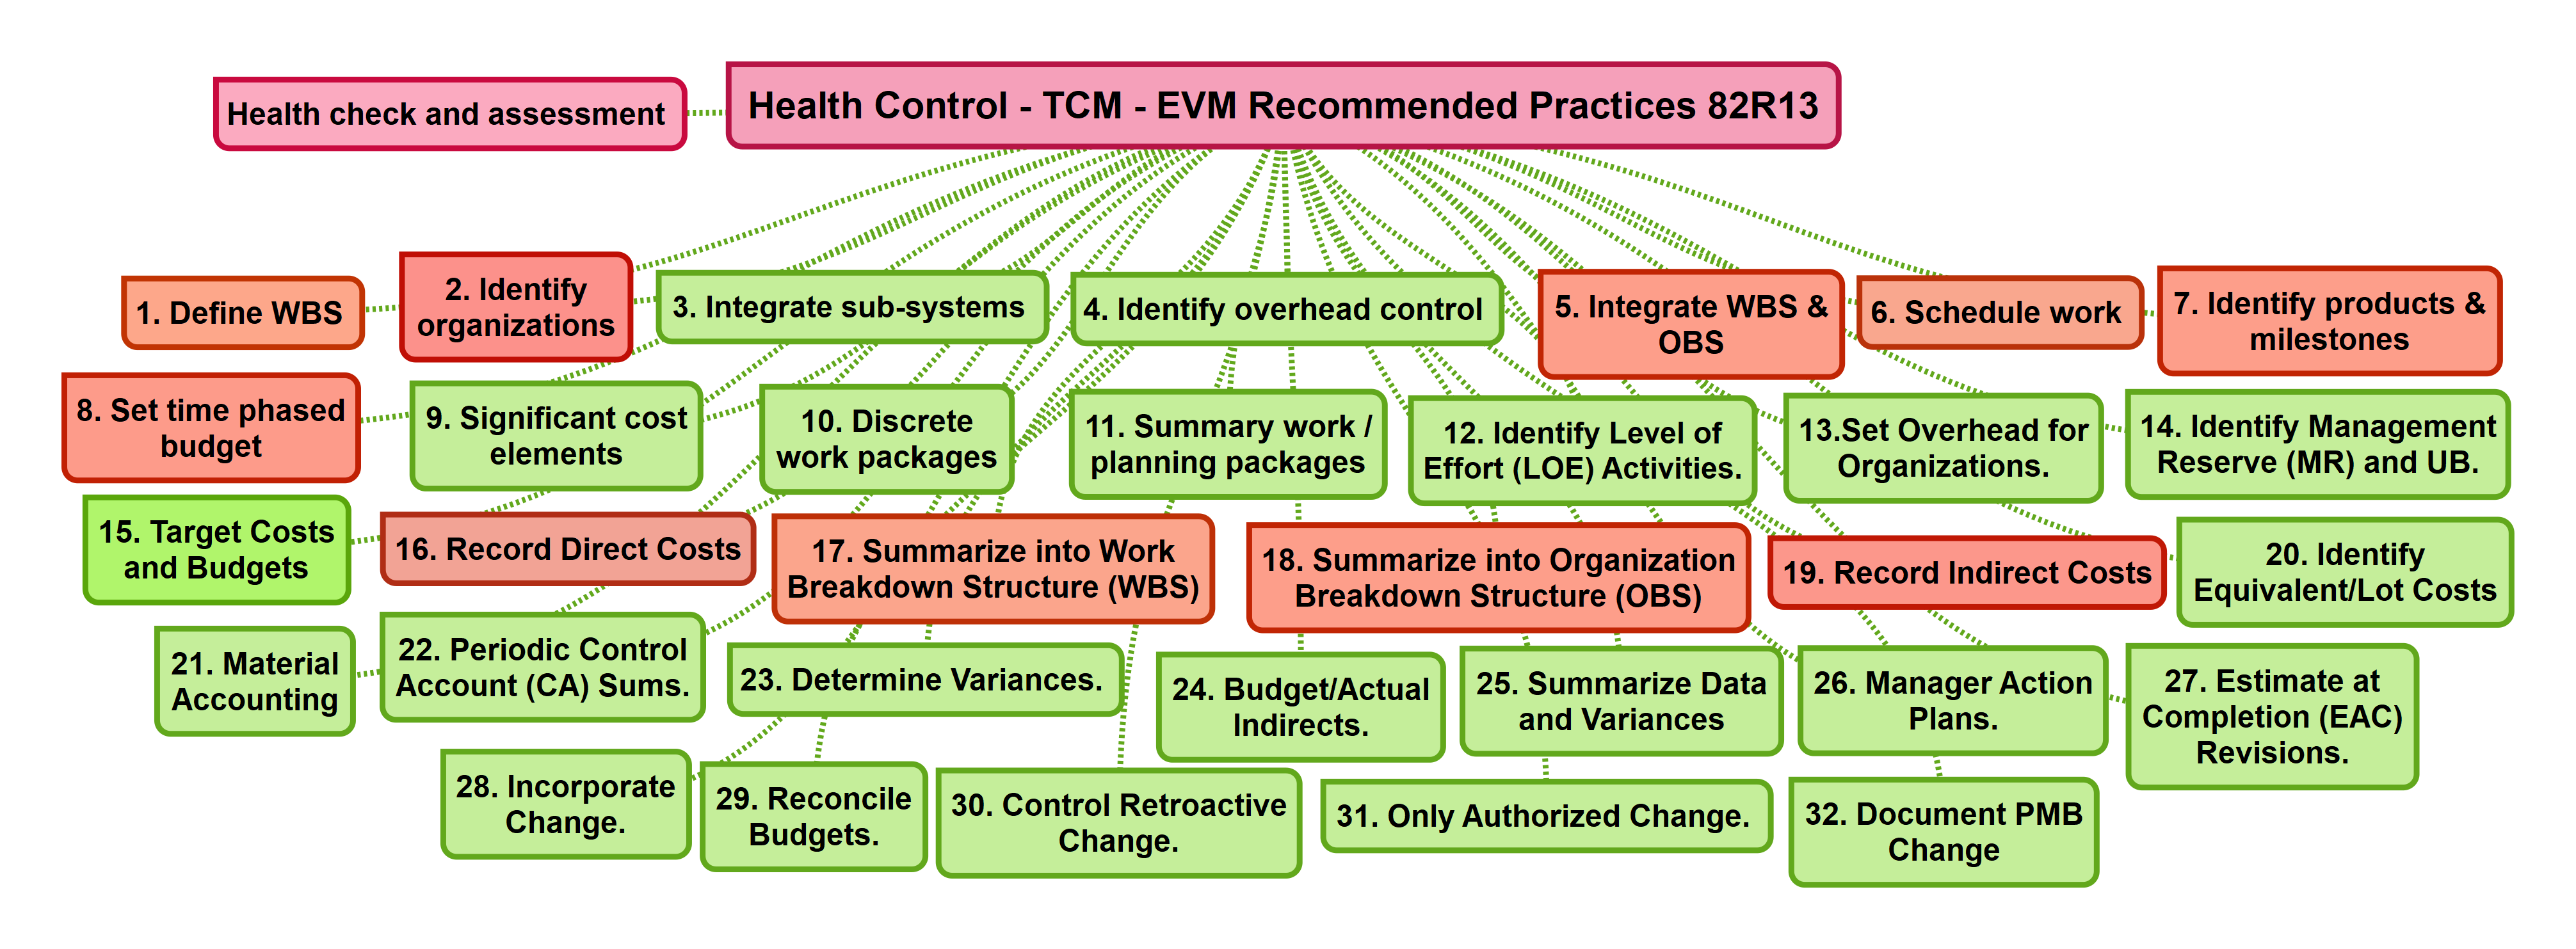
Association for the Advancement of Cost Engineering (AACE), being more function and detail-oriented, addresses this at length in their Recommended Practices. AACE defines two key concepts in EVM: 1) measurable work progress; and 2) a focus on planning to establish the performance measurement baseline (PMB) against which performance will be tracked and evaluated. AACE’s five guidelines form the foundation for the quality planning process and are identified as one of the two key concepts of EVM, namely:
1. Define Work Breakdown Structure
2. Identify Organizations
3. Integrate Subsystems
4. Identify Overhead Control
5. Integrate WBS and Organization Breakdown Structure
AACE then addresses how to generate and analyse EVM information on a routine basis. The guidelines specify at least monthly reporting although some programs receive reports and perform analysis more frequently.
But to start with, what is EVM? Why is it so useful as a measuring and monitoring tool? Let’s understand the basics.
Consider this example:
Scope of the project: This project comprises of laying a fence around a square plot of size 1 km on each side (A, B, C, D). Each side has a budget of 1000. The work is supposed to get over on the 4th week. The surveyor is conducting the survey to assess the progress after 4 weeks from the start date.
Side A, Side B, Side C are fully completed.
The Budgeted Cost of Work Scheduled BCWS(A), which is also known as the Planned Value (PV) for A = 1000$
Since ‘A’ got over, the Budgeted Cost of Work Performed BCWP(A), which is also known as Earned Value (EV) for ‘A’ = 1000$
The Actual cost (AC) incurred to complete side A = 1000$
For SIDE – B, PV=1000, EV=1000, AC=1000
For SIDE – C, PV=1000, EV=1000, AC=1000
For SIDE – D, PV=1000, EV=500, AC=800


Conclusion
A Schedule Performance Index (SPI) =>1 indicates the project is doing well schedule wise
A Schedule Performance Index (SPI) < 1, indicates that the project is lagging behind schedule wise
If the Cost Performance Index (CPI) >=1, indicates that the work is getting completed within budget
A Cost Performance Index (CPI) < 1 indicates that we have spent more than planned for the completed work.
Throughout the project if we can maintain a CPI and SPI which is greater than or equal to one, then the project is doing well schedule wise and cost wise.
The ‘S’ Curve
The ‘S curve’ is widely used in project management to track the project. At regular intervals they plot the Planned Value (PV), Earned Value (EV) and the Actual Cost (AC) . If SPI=1 and CPI=1, then all these curves would have intersected at PV.

The Budget at Completion (BAC) is the sum of ‘PV’ of all the work from start of the project till the end.
Based on these data, it is possible to forecast the Estimate at Completion (EAC)
EAC = AC + (BAC-EV) / CPI (Assumption, the nature of the work is same)
Hope this gives a brief introduction to how EVM works.
Of course, knowing this in theory is one thing, applying it is another. That’s why EVM is now part of the WRENCH philosophy and built into all our project management and monitoring solutions. In fact, based on customer feedback, we would go so far as to say that WRENCH is the only way for companies to successfully apply the principles of EVM in real life projects.
See you soon!
